- Nerd Out on Business
- Posts
- The Self-Storage Giant That Operates Like a Software Company
The Self-Storage Giant That Operates Like a Software Company
Public Storage’s show how process obsession and dynamic pricing system drive compounding profits.

Nick Horob
November 03, 2025
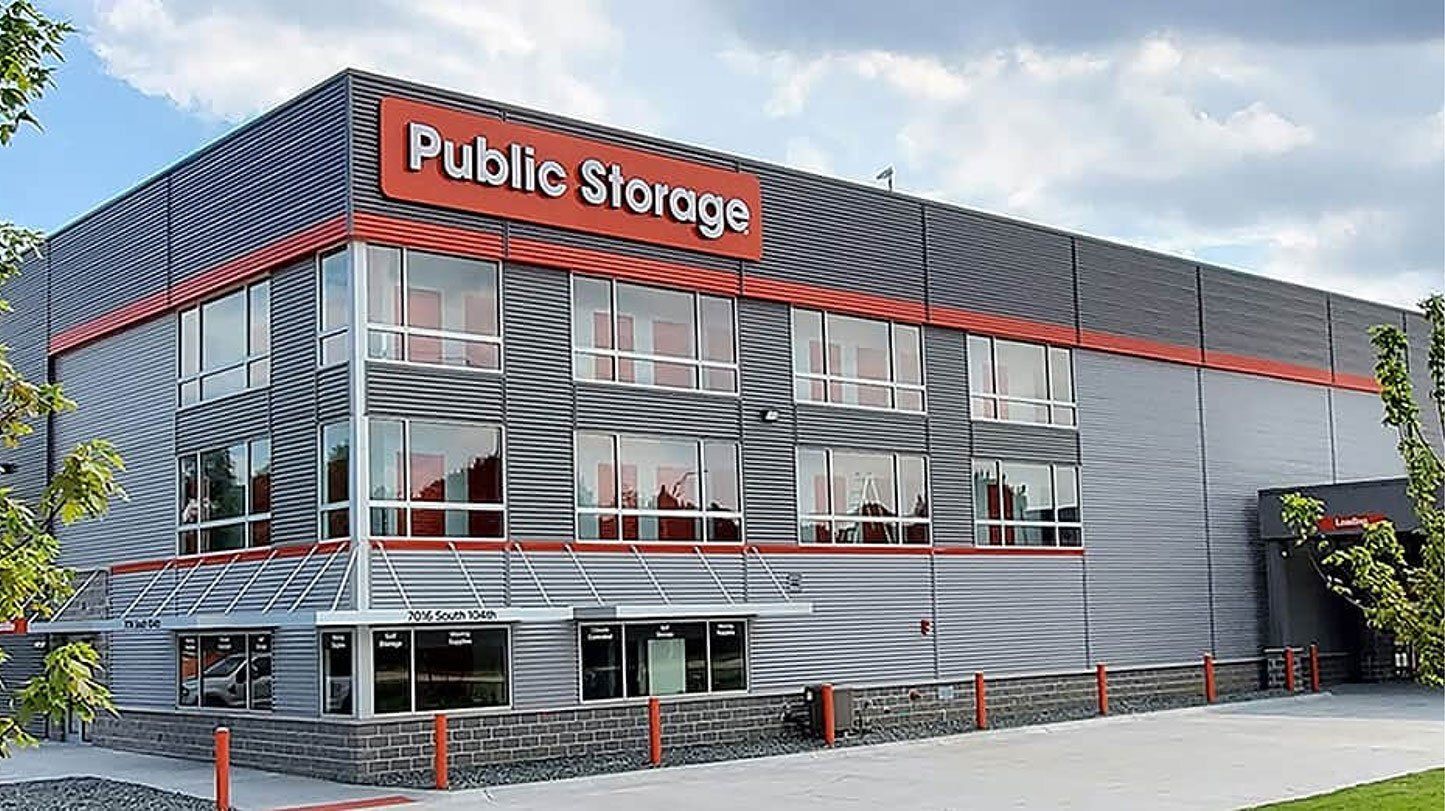
Today, I’m digging into Public Storage (NYSE: PSA). It s the largest self-storage REIT in the U.S. with more than 3,300 facilities. You've likely seen 100's of self-storage properties in your daily travel, and likely some PSA facilities, so let's peel back the onion on this process-obsessed operation.
(But first, I wanted to give a little shoutout to my brother-in-law's company, My Creative Shop. They are a small team of three builders that have built an impressive business. I'll profile them at a later date!
They empower small and growing businesses to design, print and share professional-quality marketing materials in minutes with no graphic designer needed. With thousands of easy-to-customize templates and a seamless print-and-deliver service, you can launch flyers, business cards or social graphics that elevate your brand and drive action. Click the link above to learn more about what they offer.)
Back to PSA. Here’s what stood out:
Margins that make SaaS jealous: Same-store NOI margins hover around 78–80%. Similar to Interactive Brokers, yesterday.
Operational discipline: They use dynamic pricing and standardized processes across 3,300+ facilities to keep efficiency sky-high.
Smart capital use: Low maintenance CapEx (~$240M) keeps cash flowing while they keep building and buying.
But it’s not all smooth sailing:
Rising interest costs (from $165M in '21 to $287M in '24) are starting to eat into those margins.
The self-storage market is seeing new supply in many markets, which could pressure rents.
For me, the real lesson here isn’t real estate, it’s system-building. Public Storage wins because it does the same thing thousands of times, documenting and iterating along the way, while adjusting prices daily.
With that, I'll see you tomorrow!
Nick
TL;DR
Public Storage (NYSE: PSA) is the largest self-storage REIT in the U.S. with more than 3,300 facilities and a simple, high-margin business model.
The company thrives on operational excellence, using dynamic pricing and dense local footprints to sustain high returns.
Its biggest strength is process power, not product innovation. Every system is built to squeeze more NOI per square foot.
Entrepreneurs can learn from its discipline: standardized operations, yield management, and a single-minded focus on recurring cash flow.
The 30,000-Foot View
Business Model:
Owns, develops, and operates self-storage properties, renting storage units on short-term (month-to-month) leases.
Primary revenue stream: rental income from self-storage facilities (93% of total revenue).
Secondary streams: tenant reinsurance and merchandise sales (about 7%).
Key Stats (as of TTM 2025):
Market Cap: ~$49B
TTM Revenue: $4.79B
Gross Margin: 73.0%
Net Income (FY 2024): $2.08B
Employees: ~5,900
Industry: Real Estate Investment Trust (Self-Storage)
Public Storage dominates through scale, branding, and pricing sophistication.
Company History
1972: Founded by B. Wayne Hughes and Kenneth Volk Jr. in California.
1980s-1990s: Rapid expansion across the U.S.; spun out PS Business Parks to separate non-storage assets.
2006: Acquired Shurgard Storage Centers, establishing a strong foothold in Europe.
2018–2024: Shurgard listed independently in Europe; Public Storage maintained a minority stake.
2022: Sold PS Business Parks to Blackstone, realizing a $2.1B gain.
2023: Acquired Simply Self Storage and over 160 facilities for $2.2B–$2.7B total.
2025: Continued roll-up strategy with 74 additional facilities acquired through Q3 2025.
Show Me the Money
Stand-out Financial Features
93%+ recurring revenue from short-term leases.
Industry-leading gross margins around 73%.
Maintenance capex discipline (~$240M annually).
Rising net debt tied to rapid acquisition pace.
Same-store margins consistently in the upper 70s.
(I calculated capital expenditures by adding the amounts listed under “capital expenditures to develop and expand real estate facilities” and “capital expenditures to maintain real estate facilities” from the Cash Flows from Investing Activities section of their 10-K/Q’s filings.)
Financial Data
Metric | 2022 | 2023 | 2024 | TTM 2025 |
|---|---|---|---|---|
Revenue | $4.18B | $4.52B | $4.70B | $4.79B |
Gross Profit | $3.13B | $3.37B | $3.44B | $3.49B |
Gross Margin | 74.8% | 74.6% | 73.2% | 73.0% |
Ops Profit | $2.14B | $2.29B | $2.19B | $2.23B |
Ops Margin | 51.2% | 50.7% | 46.5% | 46.5% |
CapEx | $0.77B | $0.83B | $0.75B | N/A |
Net Debt | $6.10B | $8.73B | $8.91B | $9.75B |
The N.O.O.B. Nine — Competitive Powers
The Nerd Out on Business Nine is made up of Hamliton Helmer's famous "7 Powers" of competitive advantage (Scale Economies, Network Economies, Counter-Positioning, Switching Costs, Branding, Cornered Resource, and Process Power) combined with two of my own (Data Flywheel and Distribution Advantage).
Power | Score | Rationale |
|---|---|---|
Branding | 4/5 | Iconic orange doors and category-leading name recognition lower CAC and drive walk-ins. |
Data Flywheel | 3/5 | Constant pricing and occupancy data feed better algorithms, though not exclusive to PSA. |
Process Power | 4/5 | Standardized ops, yield management, and tight expense control yield NOI margins near 80%. |
Scale Economies | 5/5 | Thousands of facilities share tech, marketing, and maintenance costs, giving major unit-cost advantage. |
Switching Costs | 2/5 | Month-to-month contracts create low customer lock-in beyond moving friction. |
Cornered Resource | 4/5 | Prime urban parcels and entitlements in tight markets are difficult to replicate. |
Network Economies | 1/5 | Tenants don’t benefit from other users. No true network effect. |
Counter-Positioning | 2/5 | Hard for small operators to compete on balance sheet, but peers like Extra Space can imitate. |
Distribution Advantage | 4/5 | Dense local footprint and dominant SEO presence capture inbound demand at low cost. |
Average Score: 3.2/5 - A solid operational moat built on efficiency and density, not network effects.
Memorable Marketing
Approach: Public Storage’s marketing philosophy is utility over flash. The company dominates Google search and maps with strong local SEO, relies on simple promotions, and uses dynamic pricing to convert demand efficiently.
Key Campaigns and Tactics:
“First Month for $1” (Ongoing)
Hook: Ultra-simple intro offer for first-time renters.
Channels: On-site banners, search ads, website modules.
Why it worked: Eliminates initial friction while dynamic pricing monetizes after move-in.
Result: Consistently high conversion and occupancy rates.
Dynamic Pricing and Scarcity Messaging (2019–2025)
Hook: Display limited availability to drive urgency.
Channels: Website, email, call center.
Why it worked: Psychological scarcity and data-driven rate management boosted REVPAF.
Result: Protected NOI margins despite market softness.
Local Density Branding (Always-on)
Hook: Be everywhere in your customer’s zip code.
Channels: SEO, Google Local listings, visible signage.
Why it worked: Dominant visibility builds trust and convenience advantage.
Result: Reinforces category leadership at low incremental cost.
Tactical Takeaways for Founders:
Use a simple top-of-funnel offer, then optimize downstream value.
Leverage scarcity truthfully to accelerate decisions.
Treat local SEO as your distribution engine.
Standardize every touchpoint for consistency.
Build geographic dominance instead of chasing national scale.
AI Uses & Opportunities
Current Uses:
AI-driven yield management and pricing optimization.
Call center automation and chatbot support for reservations.
Future Potential:
Elasticity-aware pricing: Continuously adapt rates by micro-market and demand curves.
Churn prediction: Use ML to target retention offers before move-outs.
Visual operations checks: Camera-based AI for damage and cleanliness alerts.
Labor optimization: Forecast move-in surges for staffing alignment.
Marketing mix modeling: Refine channel spend allocation beyond last-click attribution.
Bumps in the Road
Rising interest expense: FY 2024 interest costs hit $287M, cutting into cash flow.
New supply risk: Overbuilding in local markets pressures pricing.
Property tax increases: Erode same-store profitability.
Low switching costs: Tenants can leave anytime; retention is ongoing.
Integration risk: Rapid acquisitions demand tight operational onboarding.
Your Swipe File
Build process discipline before scaling. Standardization drives profit.
Keep offers simple and memorable; complexity kills conversions.
Own your local market before chasing national dominance.
Monitor unit economics relentlessly; recurring revenue isn’t automatic.
Treat maintenance and brand consistency as growth levers, not expenses.